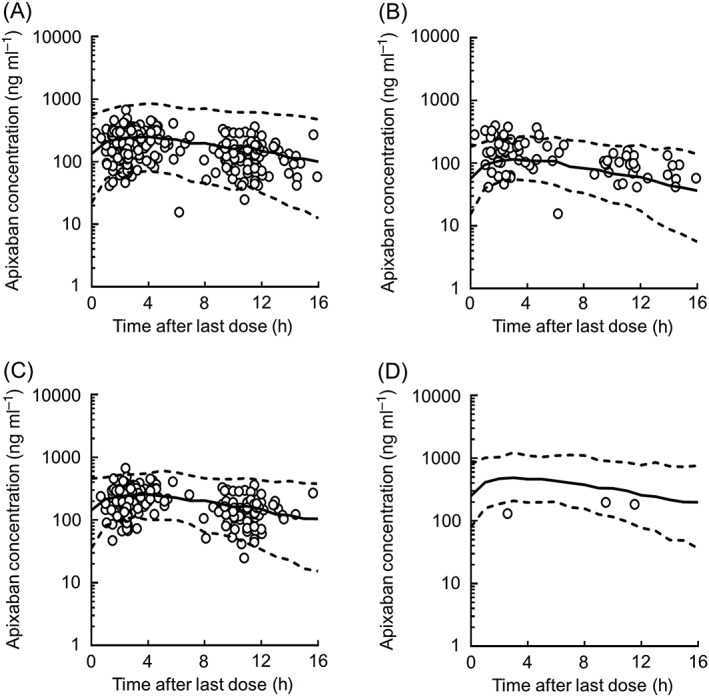
Figure 3.

Visual predictive checks of apixaban concentrations with data obtained from the final model. Open circles show the observed concentrations in all patients (A), patients administered twice daily a dose of 5 mg day−1 (B), 10 mg day−1 (C) and 20 mg day−1 (D). The top dotted, middle solid, and bottom dotted lines are shown as the 95th, 50th, and 5th percentiles, respectively, as calculated from 1000 simulated data sets
