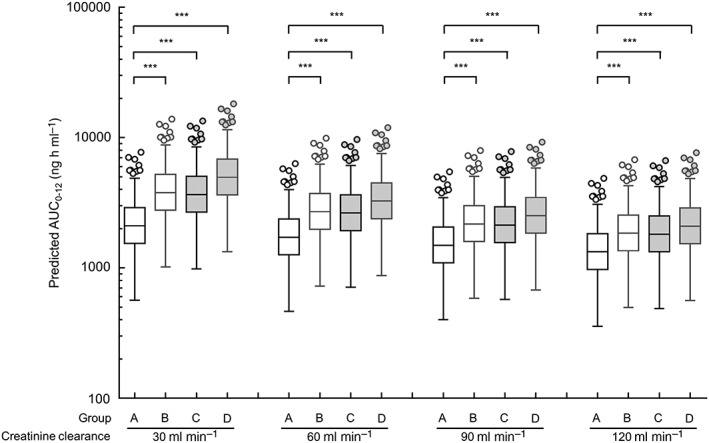
Figure 4.

Simulations of AUC from time 0 to 12 h (AUC0−12) for apixaban in the 200 replication data sets in a patient administered a typical dose of 5 mg twice daily. These simulations are conducted using the final model. The box‐and‐whisker plots are presented according to the Tukey style. Open circles show the outliers. Four groups consist of patients with the CYP3A5*1/*1 and ABCG2 421C/C or C/A genotype (group A), patients with the CYP3A5*1/*1 and ABCG2 421A/A genotypes (group B), patients with the CYP3A5*1/*3 or *3/*3 and ABCG2 421C/C or C/A genotype (group C), and patients with the CYP3A5*1/*3 or *3/*3 and ABCG2 421A/A genotypes (group D). *** P < 0.001 by the Kruskal–Wallis test, followed by Dunn's multiple comparison test
