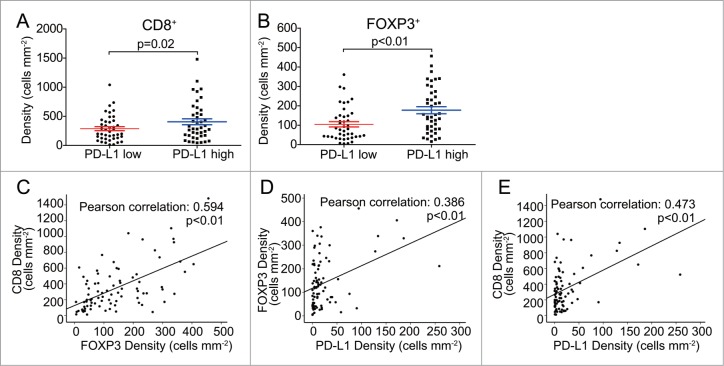
Figure 3.
Independent analysis and correlation of CD8T, FOXP3 Treg and PD-L1 cells in GC tissues. A-B. Significantly different densities of CD8T and FOXP3 Treg cell were detected in GC tissues of PD-L1 low or high densities group (p < 0.05). C-E. Scatter plots of significant correlations, Data are represented in a scattered plot for densities of CD8 and FOXP3, FOXP3 and PD-L1, CD8 and PD-L1 with the best fit line shown (n = 84 for tumor tissues). Correlation coefficient (r-value) and p-value of Pearson's correlation test is given on top of each panel. Error bars represent SEM.

