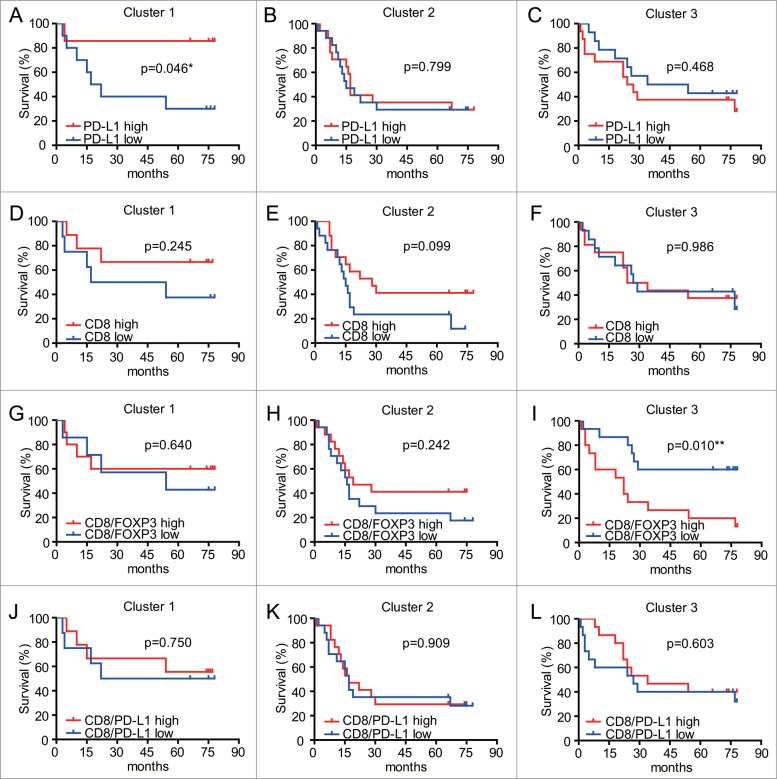
Figure 5.
Kaplan-Meier analyses of overall survival (OS) for CD8/FOXP3 and CD8/PD-L1 in subgroups of patients based on CD8 or PD-L1 levels. A-C. Survival outcomes of the 84 GC with different expression of PD-L1 from 3 clusters generated according to their CD8/FOXP3 and CD8/PD-L1 ratios. Patients with higher PD-L1 expressions in Cluster 1 had significantly better survival (p < 0.05). D-F. Survival outcomes of the 84 GC with different expression of CD8 in the 3 clusters. Kaplan-Meier analyses of overall survival (OS) for CD8/FOXP3 and CD8/PD-L1 in subgroups of patients. G-I. Survival outcomes of the 84 GC patients with different expression of CD8/FOXP3 in the 3 clusters. Patients with lower CD8/FOXP3 levels in Cluster 3 had significantly better survival (p < 0.05). J-L. Survival outcomes of the 84 GC patients with different expression of CD8/PD-L1 in the 3 clusters. A-L. A median cutoff was used to separate high and low densities. Statistical analyses were generated using Log rank test.

