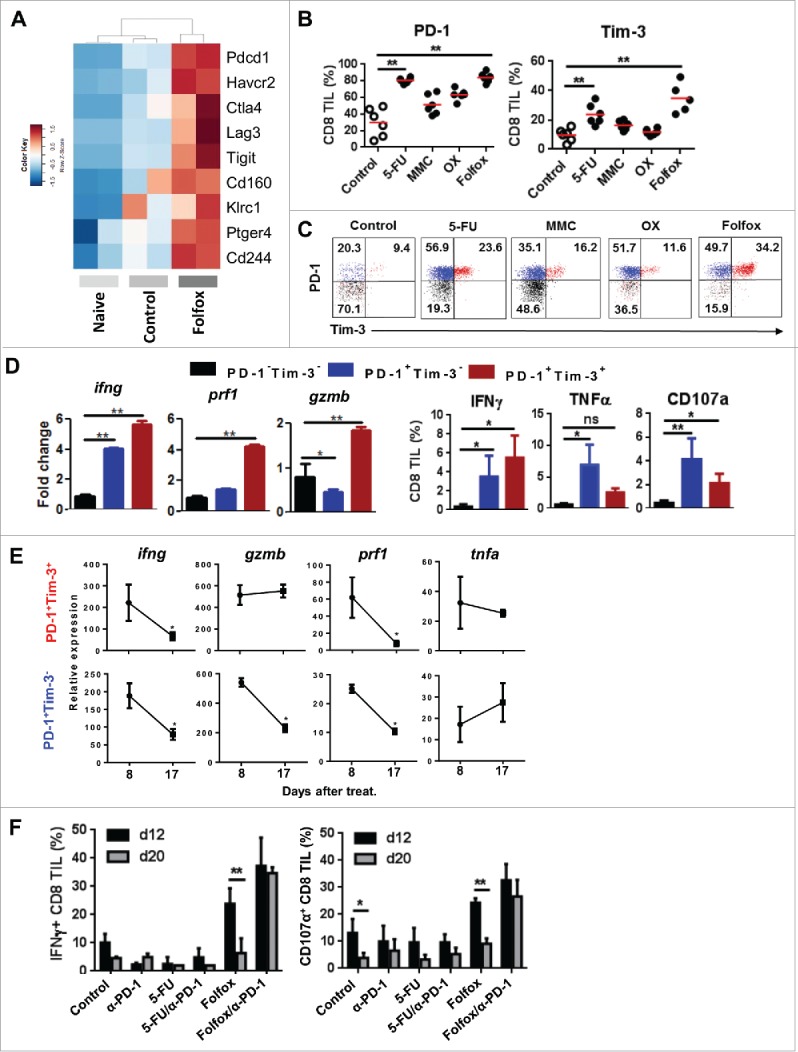
Figure 3.

Folfox favors the infiltration of tumors by functional PD-1+ CD8 T cells. (A) CT26 tumor-bearing mice were treated with glucose 5% (control) or Folfox. FACS-sorted CD8 TILs were pooled (n = 10/group) and subjected to RNA-sequencing. Naïve CD8 T cells were used as reference. Heatmap of expression of genes associated with inhibitory receptors is shown (two samples per condition). (B-C) CT26 tumor-bearing Balb/c mice (n = 6/group) were treated with the different chemotherapies. (B) Frequency of PD-1 and Tim-3 was determined by flow cytometry (Kruskal-Wallis test). (C) Representative dot plot of PD-1 and Tim-3 expression on CD8 TILs. (D) Percoll-isolated TILs were harvested from Folfox-treated mice. (Left) CD8 TILs (n = 4) were FACS-sorted according to PD-1 and Tim-3 expression. mRNA IFNγ (ifng), Perforin (prf1) and Granzyme B (gzmB) expression was measured in each subset by RT-PCR. β-Actin was used as reference (Mean ± s.d of experimental replicates, Kruskal-Wallis test). (Right) Frequency of IFNγ, TNF-α, and CD107a produced by CD8 TILs after anti-CD3 stimulation (Mean ± s.d, Kruskal-Wallis test). (E) CD8 TILs were FACS-sorted according to PD-1 and Tim-3 expression. Relative mRNA expression to actin of IFNγ (ifng), Perforin (prf1), Granzyme B (gzmB) and TNF-a (tnfa) by RT-PCR at day 8 and day 17 post-treatment (Mean ± s.d. of experimental replicates, Mann-Whitney test). (F) CT26 tumor-bearing Balb/c mice (n = 3-4/group) were treated with glucose 5% (control) or Folfox combined or not with anti-PD1 therapy. IFNɣ and CD107 a produced by CD8 TIL 12 and 20 days after treatment (Mean ± s.d.,Sidak test). **p < 0.01; ns, not significant. Data are representative of one (A), two (E,F) or at least three (B-D) independent experiments. See also Supplementary Figs. 4 and 5.
