
Figure 4.
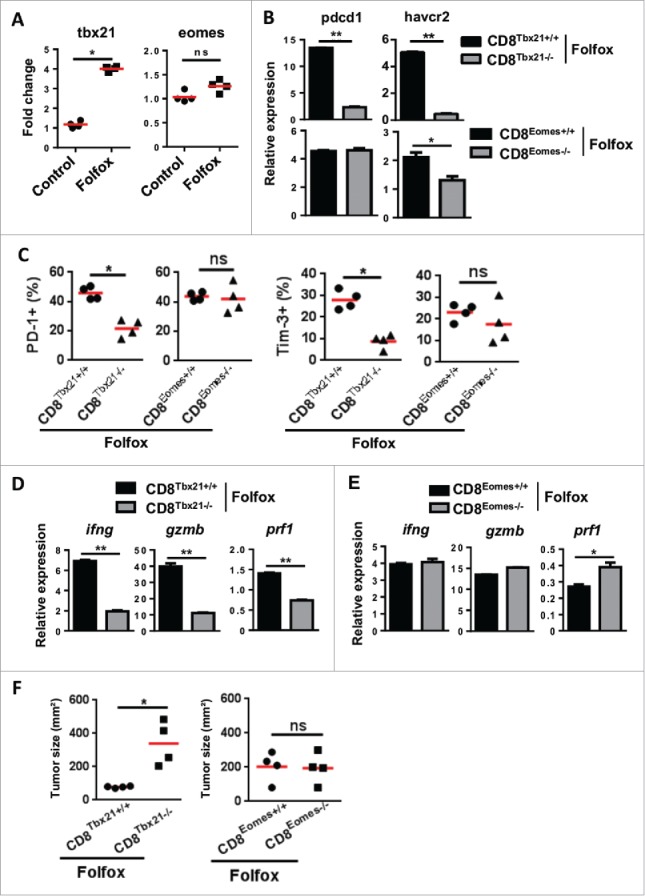
T-bet drives the induction of functional CD8 TILs after Folfox therapy. (A) CT26 tumor-bearing mice were treated with Folfox (n = 4/group) and FACS-sorted CD8 TILs were pooled. T-bet (Tbx21) and Eomes (Eomes) mRNA expression was assessed by RT-PCR. β-Actin was used as reference and data were normalized to control (Mean ± s.d of four experimental replicates, Mann-Whitney test). (B-F) MC38 tumor-bearing C57BL/6 mice deficient in CD8 T cells for Tbx21 (CD8Tbet−/−), Eomes (CD8Eomes−/−) and their respective control mice CD8Tbet+/+ or CD8Eomes+/+ were treated with Folfox (n = 4/group). (B) CD8+ TILs from each group were FACS-sorted then pooled and the relative expressions of PD-1 (Pdcd1) and Tim-3 (Havcr2) mRNA were analyzed by RT-PCR. β-Actin was used as reference (Mean ± s.d. of technical replicates, Mann-Whitney test). (C) Expression of PD-1 (left) and Tim-3 (right) on CD8 TILs by flow cytometry. Each dot represents one individual (Mann-Whitney test). (D-E) Relative mRNA expression of IFNγ (Ifng), Perforin (Prf1) and Granzyme B (Gzmb) in FACS-sorted CD8 TILs from controls and (D) CD8Tbet−/− and (E) CD8Eomes−/− mice. β-Actin was used as reference (Mean ± s.d. of technical replicates, Mann-Whitney test). (F) Tumor growth measured 8 days following treatment. Each dot represents one individual (n = 4/group, Mann-Whitney test). *p < 0.05; **p < 0.01; ns, not significant. Data are representative of two independent experiments. See also Supplementary Fig. 6.