Figure 5.

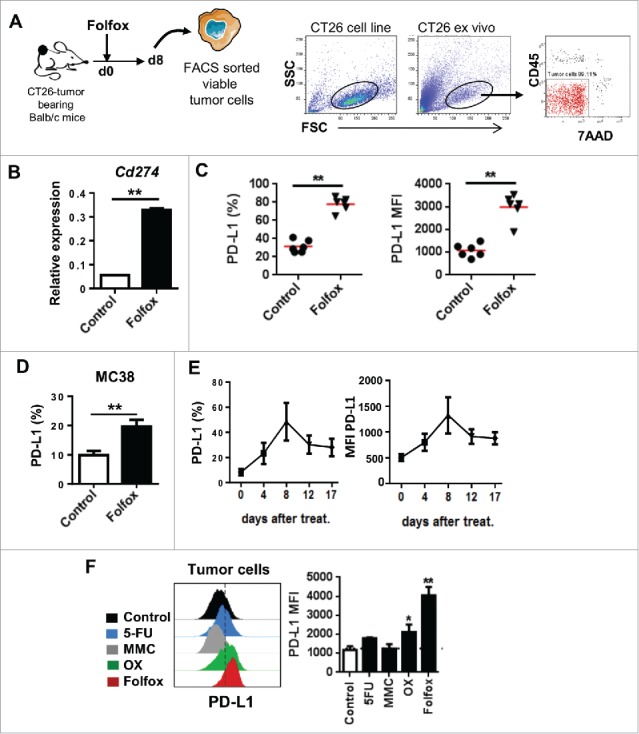
Folfox induces PD-L1 expression on tumor cells in vivo. (A-C) CT26-tumor bearing mice were treated either with glucose 5% (control) or Folfox and tumors were harvested 8 days after treatment. (A) Scheme of the experiment and gating process to isolate viable tumor cells (CD45/7AAD-negative) by FACS (See also Materials and Methods). (B) Relative expression level of PD-L1 (Cd274) mRNA analyzed by RT-PCR. β-Actin was used as reference (n = 3/group, mean ± s.d., Mann-Whitney test). (C) Expression of PD-L1 determined by flow cytometry on viable tumor cells (n = 6/group, each dot represents one individual, Mann-Whitney test). (D) MC38 tumor-bearing C57BL/6 mice were treated with glucose 5% (control) or Folfox (n = 3/group). Expression of PD-L1 on viable tumor cells by flow cytometry 8 days after treatment (Mean ± s.d, Mann-Whitney test). (E) Monitoring of PD-L1 expression on viable tumor cells from Folfox-treated mice over seventeen days post-treatment (n = 4/group, mean ± s.d.). (F) CT26-tumor bearing Balb/c mice were treated as in Fig. 2C (n = 5/group). Expression of PD-L1 on viable tumor cells by flow cytometry 8 days after treatment is shown. Dashed line delineates the FMO control (Mean ± s.d.,Kruskal-Wallis test). Data are representative of 2 experiments (B, D-F) or more than 4 independent experiments (C). *p < 0.05, **p < 0.01. See also Supplementary Fig. 7.
