Figure 7.

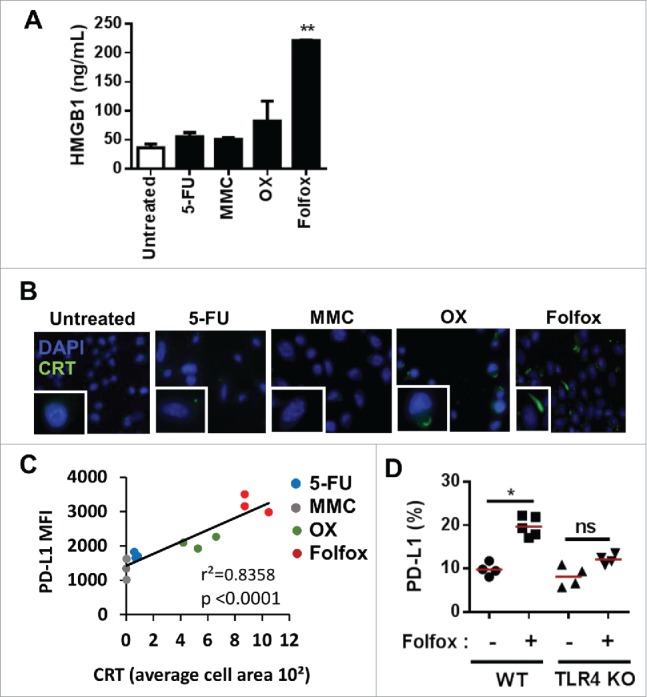
The induction of immunogenic tumor cell death drives PD-L1 expression on tumor cells in vivo. (A-B) CT26 colorectal tumor cells were treated in vitro with or without 5-Fluorouracil (5-FU, 10 µM), Mitomycin (MMC, 20 µM), Oxaliplatin (OX, 50 µM) or Folfox (5-FU, 10 µM + OX, 50 µM). (A) HMGB1 release by ELISA 24 H after treatment (Mean ± s.d of experimental replicates, Kruskal-Wallis test). (B) Immunofluorescence analysis of calreticulin (CRT) exposure at the membrane 6 h after treatment. (C) Correlation between calreticulin (CRT) exposure on CT26 tumor cells treated in vitro with the different chemotherapies and PD-L1 expression on tumor cells in vivo (Pearson correlation) (n = 3/group). (D) MC38 tumor-bearing C57BL/6 and TLR4-deficient mice were treated with glucose 5% (-) or Folfox (+). PD-L1 expression on viable tumor cells 8 days after treatment is depicted (n = 4-5/group, Kruskal-Wallis test). Each dot represents an individual measurement in one individual. *p < 0.05; **p < 0.01; ns, not significant. Data are representative of two independent experiments. See also Supplementary Fig. 8.
