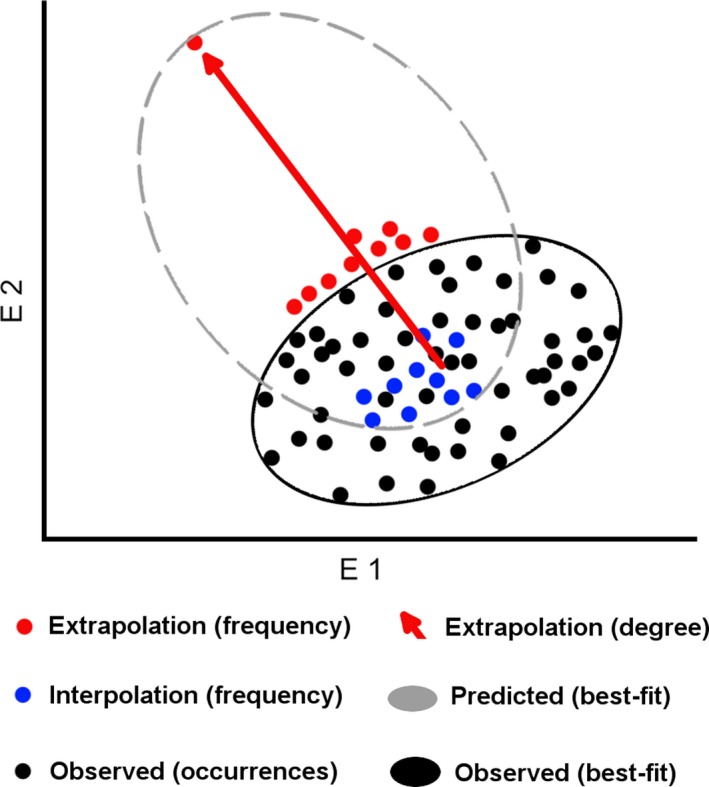
Figure 2.

New performance metrics for environmental space. Available occurrences were displayed in a two‐dimensional environmental space (black points) to estimate a minimum‐volume ellipsoid resembling the observed niche (black ellipsoid). E‐space index I: Model prediction values were categorized as frequency of interpolation (i.e., number of points predicted inside the observed range; blue points) and frequency of extrapolation (i.e., number of points predicted outside the observed range; red points). E‐space index II: This metric compares model's fit with degree of extrapolation. Model fit was measured as the Jaccard index of similarity between the volume of the modeled niche (gray ellipsoid) versus the volume of the observed niche (gray ellipsoid). This metrics also included the degree of extrapolation as the niche distance between the centroid of the observed niche and the most distance prediction of the modeled niche: Note the arrow indicating maximum extrapolation distance between central values of observed data (black points) and most extrapolative values predicted by the model (farthest red point)
