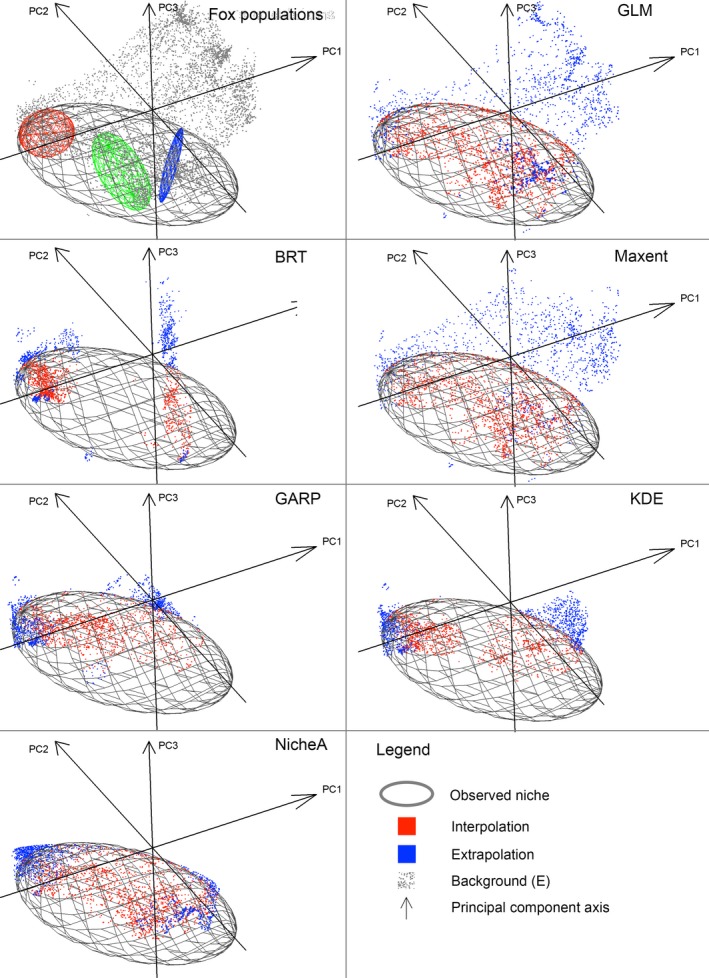
Figure 5.

Model evaluations based on interpolation and extrapolation in environmental space (threshold = 0%). Top left: Darwin's Fox populations, from the northern (blue ellipsoid), central (green ellipsoid), and southern (red ellipsoid); populations were enclosed to generate observed ecological niche hypotheses; the environmental background is shown in this panel as gray points. Subsequent panels: Predictions were categorized according to environmental interpolation (red points) as predictions inside the ellipsoid and environmental extrapolation (blue points; see Section 2) as predictions outside the ellipsoid; the environmental background is not shown in these panels for better visualization of models output. GLM, generalized linear model; BRT, boosted regression trees; Maxent, maximum entropy; GARP, genetic algorithm for rule‐set production; KDE, hypervolume multivariable kernel density estimation; NicheA, minimum‐volume ellipsoid. Note that predictions by some models resemble the background cloud (e.g., GLM and Maxent), suggesting that all the conditions available in the model calibration area were predicted suitable by the model via model interpolation (red points) or extrapolation (blue points)
