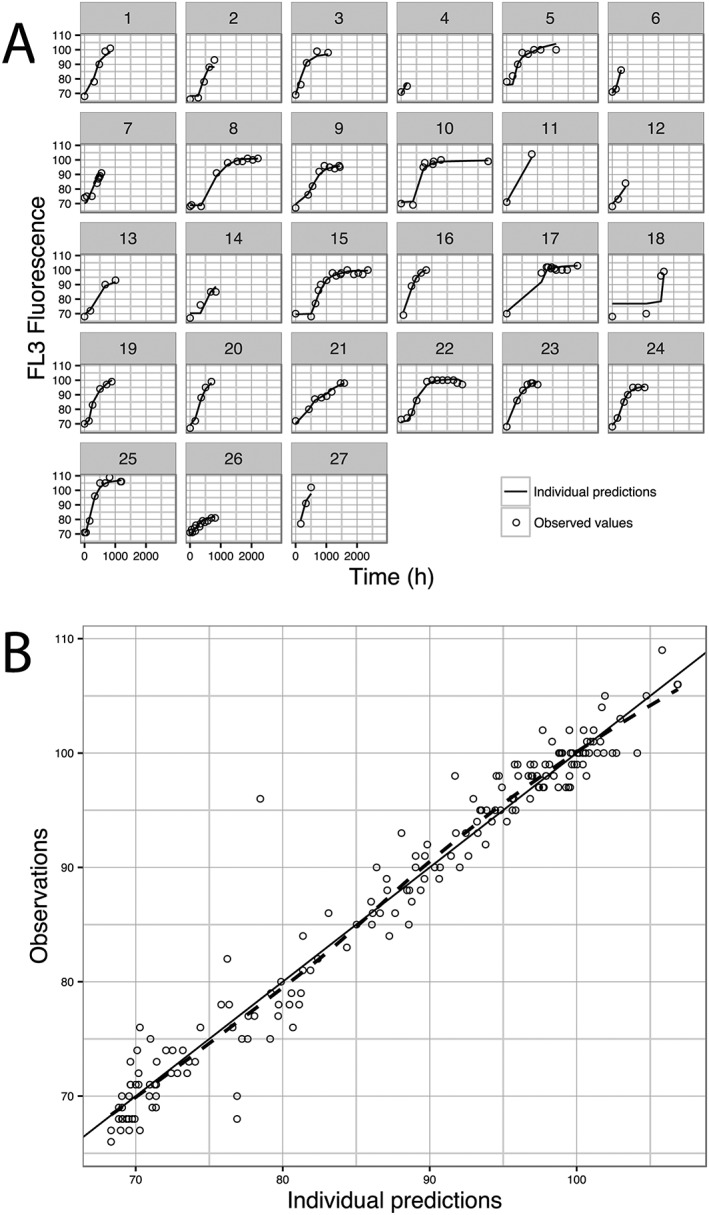
Figure 2.

Goodness of fit plots. (A) individual time course of observed (DV) and model derived individual predictions (IPRED) for FL3‐fluorescence; (B) DV vs. IPRED, black line shows line of identity and blue line is the trend line showing the relation between DV and IPRED
