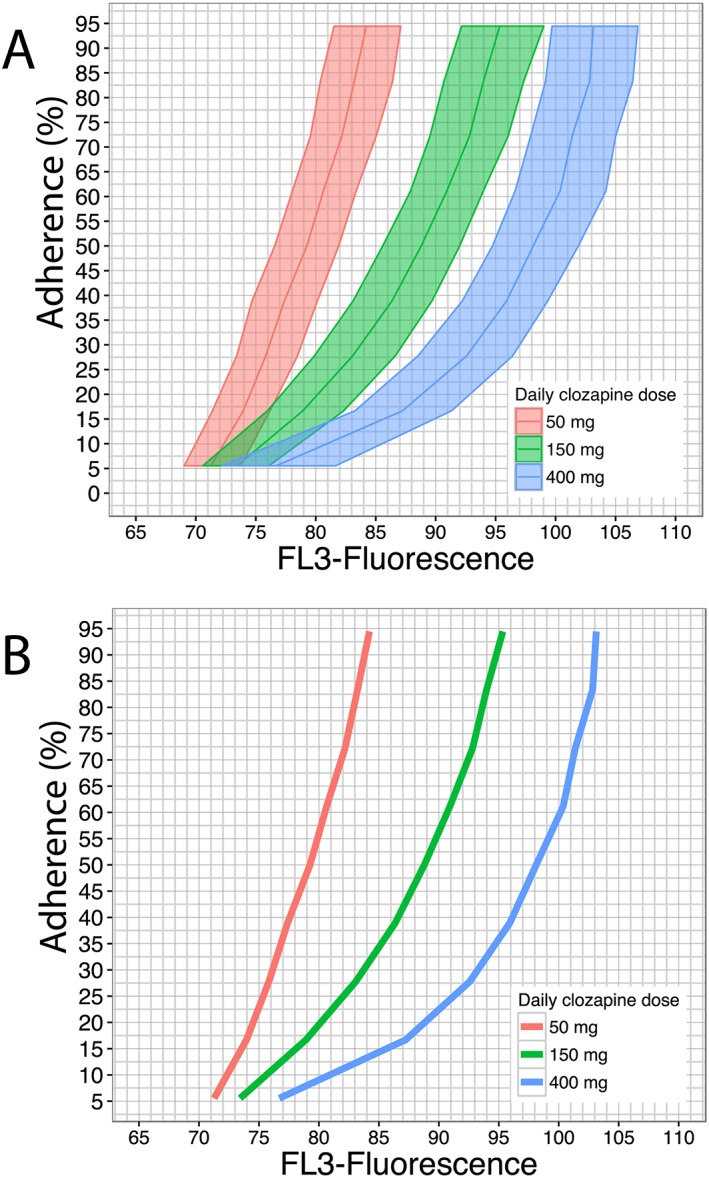
Figure 3.

Simulation results and proposed nomogram. (A) Simulation results: 100‐day study with 10 000 patients in each study arm (clozapine 50, 150 and 400 mg daily). FL3‐fluorescence values at the end of study period (steady state) are plotted against treatment adherence values. Results have been stratified per dosing level [red: 50 mg daily (QD); green: 150 mg QD; blue: 400 mg QD]. Solid lines and shaded areas represent FL3‐fluorescence median and interquartile range, respectively, across treatment adherence values for different dosing arms. (B) Proposed nomogram for treatment adherence estimation, defined by a representation of solely median FL3‐fluorescence values as were also depicted in Figure 3A
