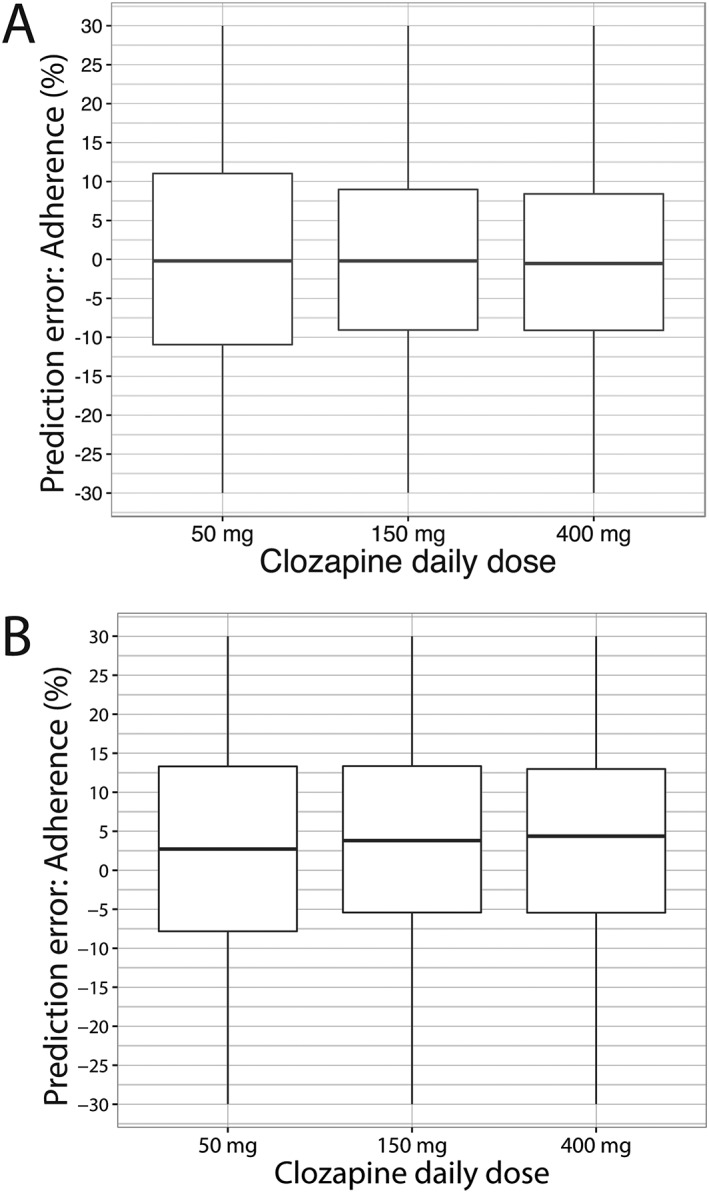
Figure 4.

Prediction error of the nomogram. (A) Prediction error when nomogram is tested in patients having random adherence. (B) Prediction error when nomogram is tested with patients having nonrandom adherence (on the last day before FL3‐fluorescence analysis, patients with adherence levels equal or above 80% took the prescribed dose, and those patients with adherence below 80% took double the prescribed dose). Box and whisker plots depict the median and interquartile range of the prediction error
