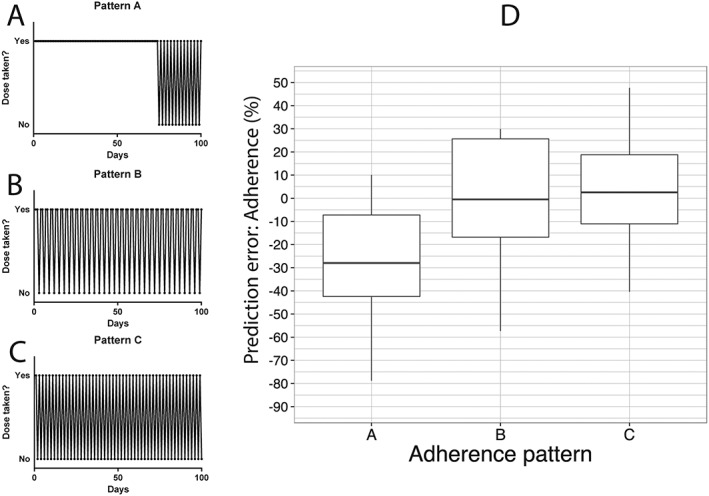
Figure 5.

Nonrandom adherence patterns and prediction error of the nomogram. (A) Pattern A: until day 75 all doses were taken in. From day 75 a dose was not taken every 2 days. Thus, the overall adherence rate is nearly 90%. (B) Pattern B: throughout all 100 days, starting from day 1 a dose was not taken every 3 days. Thus, the overall adherence rate is nearly 66%. (C) Pattern C: throughout all 100 days, starting from day 1, a dose was not taken every 2 days. Thus, the overall adherence rate is nearly 50%. (D) Prediction error when the nomogram is tested in patients following patterns A, B and C
