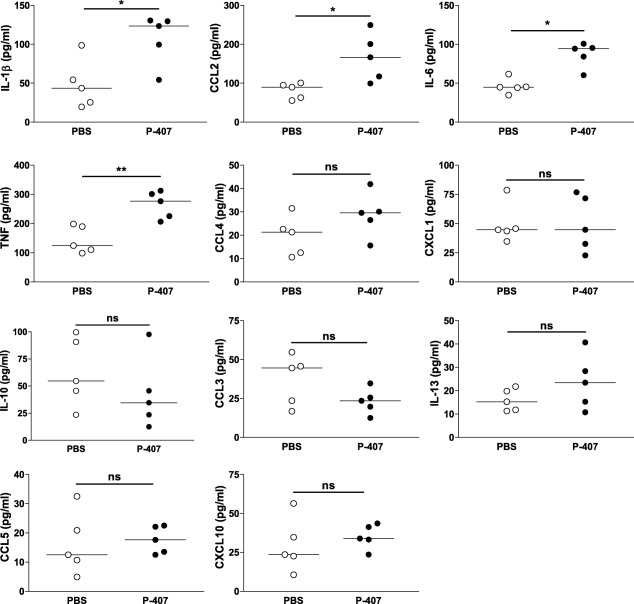
Figure 3.

Cytokine and chemokine levels in hyper‐triglyceride‐rich lipoprotein (TGRL) mice following accelerated nephrotoxic nephritis (ANTN). Plasma levels measured at day 28 in chow‐fed B6 mice injected with either 10 mg poloxamer 407 (P‐407) or phosphate‐buffered saline (PBS), as Fig. 1a, n = 5 in each group. Each dot represents a mouse; horizontal bars indicate the median; Mann–Whitney U‐test. *P < 0·05; **P < 0·01; n.s. = not significant.
