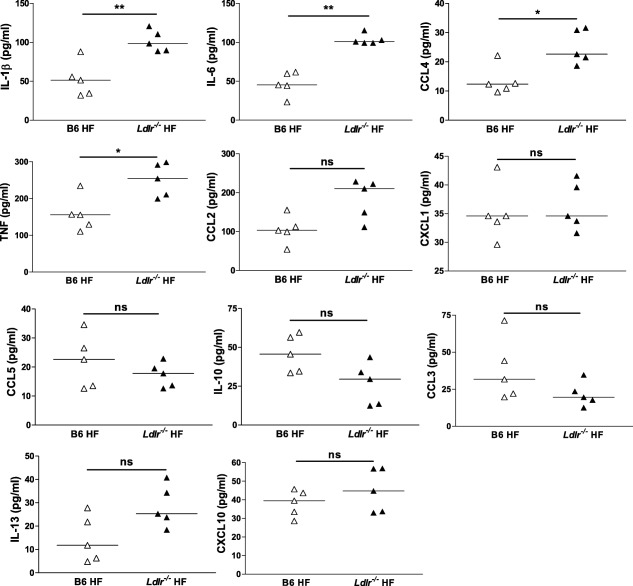
Figure 5.

Cytokine and chemokine levels in high‐fat (HF)‐fed Ldlr–/– mice following accelerated nephrotoxic nephritis (ANTN). Plasma levels measured at day 28 in Ldl–/‐‐ and B6 female fed HF diet. Each dot represents a mouse; horizontal bars indicate the median; Mann–Whitney U‐test; n = 5/group. *P < 0·05, **P < 0·01; n.s. = not significant.
