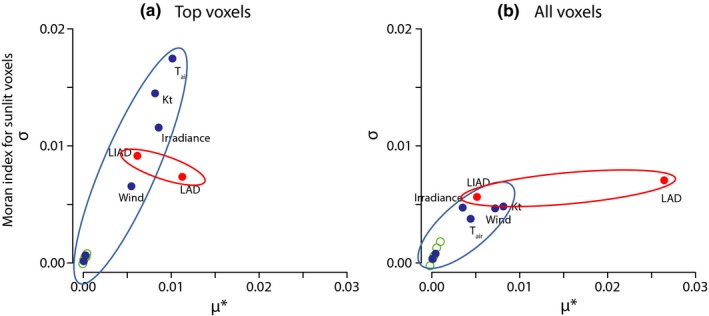
Figure 4.

Morris analysis of the Moran index (an index of spatial aggregation of voxel temperatures) for (a) top‐viewed voxels (two‐dimensional, left) and (b) all voxels (three‐dimensional, right) in the continuous canopy. Parameter types are color‐coded: Blue indicates climatic parameters, red structural, and green physiological. Ellipses were drawn for clarity. Both climatic and structural parameters have strong effects on spatial aggregation of temperatures. The effects of LAD are especially pronounced and are magnified in Figure 4b because of strong vertical differences in the canopy between top and interior voxels
