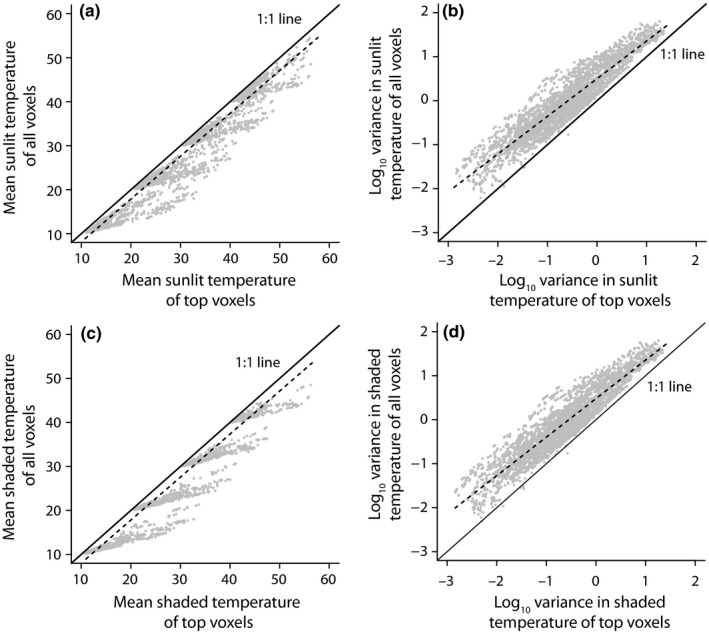
Figure 6.

Regression analysis of mean temperature and variance of all voxels in the continuous canopy as function of top‐viewed voxels for both sunlit (a, b) and shaded (c, d) portions of voxels. Color‐coded versions of these figures are available in Appendices S4–S7, which show the effects of four other main variables (Tair, wind, irradiance, and LAD) on these relationships (Figure 6a, linear regression: p < .001, R 2 = .95, y = 0.97x − 1.62; Figure 6b: p < .001, R 2 = .87, y = 0.87x + 0.50; Figure 6c: p < .001, y = 0.98x − 1.75; Figure 6d: p < .001, R 2 = .87, y = 0.87x + 0.48)
