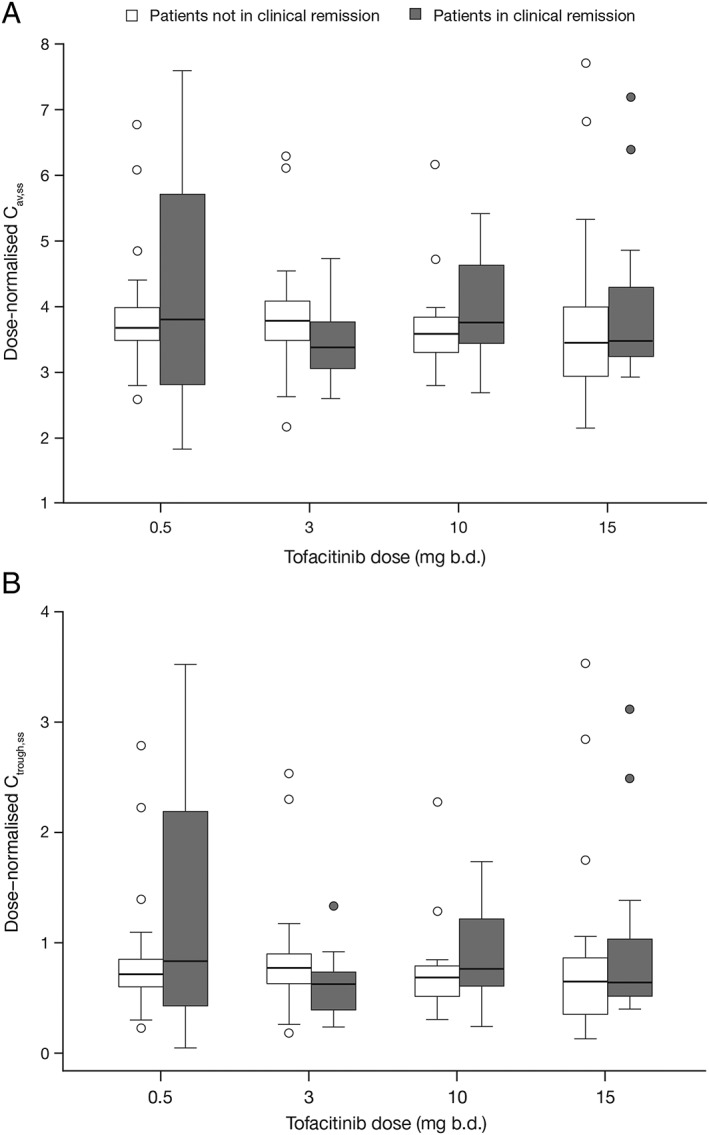
Figure 3.

Distribution of individual dose‐normalised Cav,ss values (A), and Ctrough,ss values (B) in patients in clinical remission, and those not in clinical remission, at week 8, represented by box plots. Boxes represent interquartile range and the bold line in each box represents the median. Whiskers represent 95% confidence intervals and outliers are shown as symbols. b.d., twice daily; Cav,ss, average plasma drug concentration during a dosing interval at steady state
