
Figure 5.
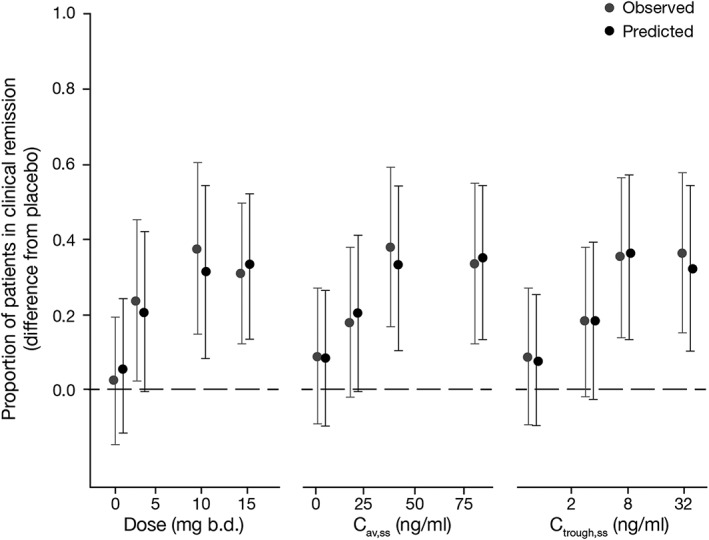
Observed and predicted placebo‐adjusted clinical remission as a function of tofacitinib dose, Cav,ss and Ctrough,ss. Error bars represent 95% confidence intervals for observed data and 95% prediction intervals for predicted data. Two‐sided 95% confidence interval for observed data obtained from a chi‐squared test for difference in independent proportions; two‐sided 95% prediction interval obtained from 5000 simulated parameter vectors from the final models. b.d., twice daily; Cav,ss, average plasma drug concentration during a dosing interval at steady state; Ctrough,ss, trough plasma concentration at steady state