
Figure 2.
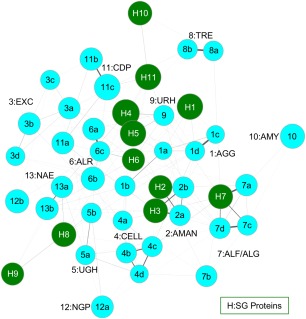
GRASP‐Func clustering of 6‐HG known function (light blue) and SG (dark green) proteins. Proteins are represented as nodes. The thickness of each edge shows the degree of similarity between the two connected proteins. PDB IDs for proteins of known function: 1gai, 1ayx, 1lf9, 1ug9 (1a–d); 3qt9, 3qsp (2a–b); 1cem, 1wu4, 1v5c, 1h12 (3a–d); 1clc, 1kfg, 1ksc, 1ia6 (4a–d); 2d5j, 2zzr (5a–b); 2okx, 3w5m, ALR1 (6a–c); 4ufc, 2eac, ALF1, ALF2 (7a–d); 2jf4, TRE1 (8a–b); 2d8l (9); 3ren (10); 1v7x, 2cqs, CDP1 (11a–c); 1h54, NGP1 (12a–b); 1fp3, 2gz6 (13a–b). Each SG protein is numbered based on its Label in Table S12, Supporting Information.