Figure 1.

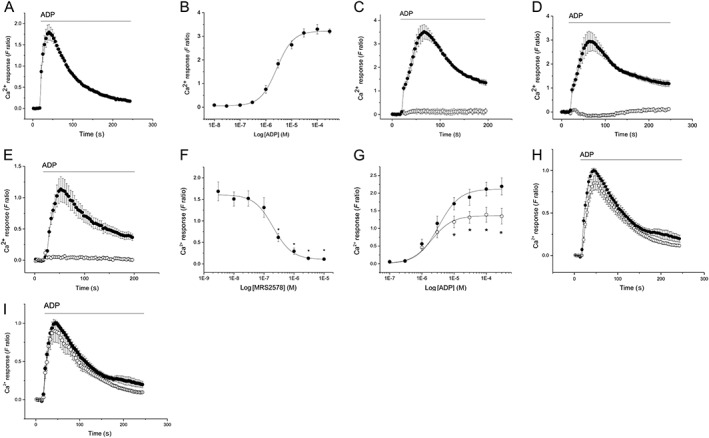
P2Y6 receptor mediates ADP‐evoked intracellular Ca2+ responses in THP‐1 cells. (A) Averaged (n = 5) intracellular Ca2+ response evoked by ADP (30 μM). (B) Concentration‐dependency of ADP‐evoked responses (EC50 2.7 ± 0.3 μM; n = 5). Abolition of responses evoked by 30 μM ADP in control conditions (closed circles) or following pre‐incubation (open circles) with 5 μM U73122 (C) or 1 μM thapsigargin (D); n = 5 for both. (E) ADP concentration‐response curve in the absence (closed circles) and presence (open circles) of 300 nM MRS2578 (n = 5). (F) Concentration‐inhibition curve for P2Y6 antagonist MRS2578 on intracellular Ca2+ response evoked by ADP (3 μM; n = 5). (G) ADP concentration‐response curve in the absence (closed circles) and presence (open circles) of 300 nM MRS2578 (n = 5). (H and I) Averaged (n = 5) intracellular Ca2+ responses evoked by 3 μM ADP in the presence of vehicle (closed circles) or in the presence of P2Y1 antagonist 1 μM MRS2500 (H; open circles) or P2Y13 antagonist 10 μM MRS2211 (I; open circles). For all experiments, F ratio is the ratiometric measurement of intracellular Ca2+ using fura‐2. *P < 0.05.
