Figure 3.

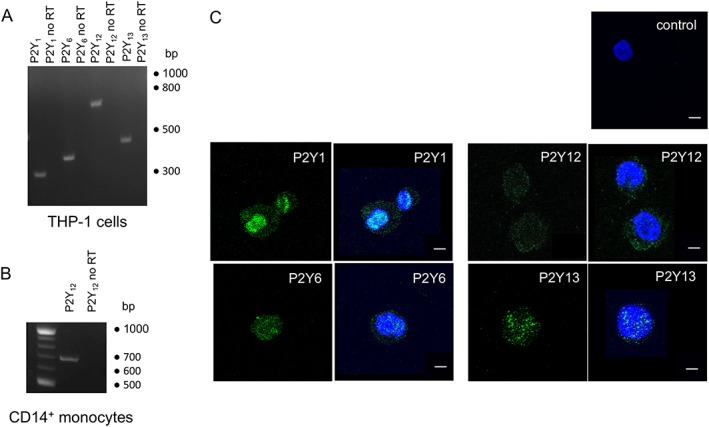
Expression of ADP‐activated P2Y receptors in THP‐1 cells. (A) RT‐PCR analysis of P2Y1 (326 bp), P2Y6 (391 bp), P2Y12 (698 bp) and P2Y13 (461 bp) receptor expression in THP‐1 monocytes. RT‐PCR analysis of P2Y12 receptors (698) expression in freshly isolated CD14+ monocytes from human peripheral blood. For (A) and (B): predicted PCR ampilicon size given in parentheses; no RT (no reverse transcriptase) denotes negative control experiments for genomic DNA contamination. (C) Representative confocal microscopy images showing P2Y primary antibody immunoreactivity in fixed THP‐1 cells. Cells are labelled with polyclonal antibodies against P2Y receptor subunits and fluorescence (green) visualized by using a AF488‐conjugated secondary antibody (lefthand panels). The “control” is representative of an experiment where primary antibodies have been omitted. Cells are counterstained with diamidino‐2‐phenylindole to identify nuclei (blue; in overlay in righthand panel). Scale bar is 5 μm. Experiments are representative of at least three independent experiments.
