
Figure 3.
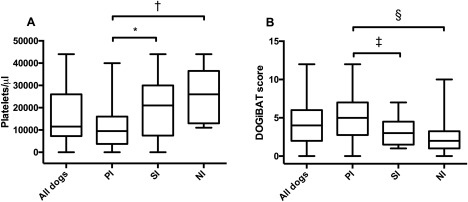
Box plots of platelet counts (A) and DOGiBAT scores (B) on admission in all dogs, dogs with PI, SI, and NI thrombocytopenia. In each case, the box represents the interquartile range, the horizontal line represents the median, and the whiskers represent the data range. *P = .034; †P = .003; ‡P = .021; §P = .01