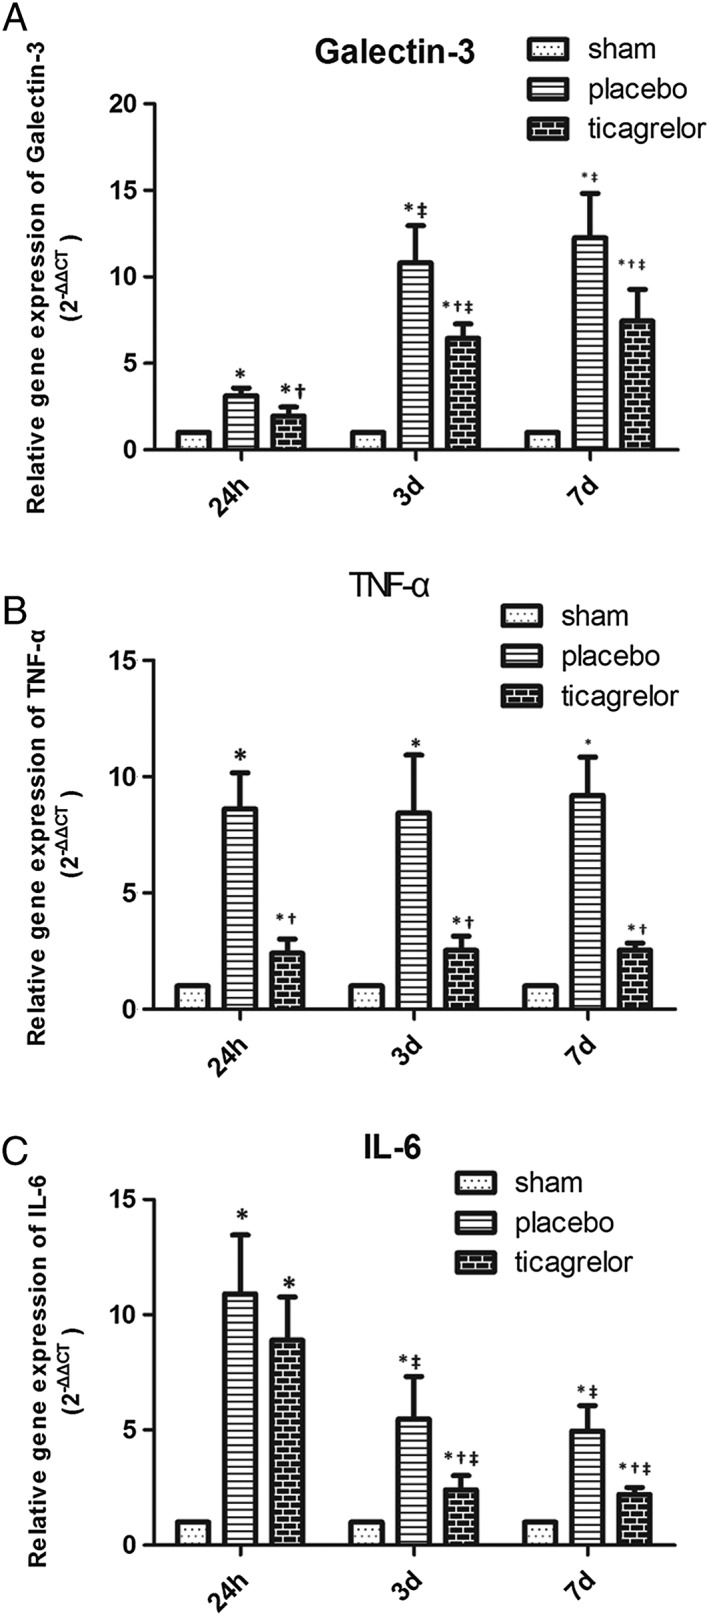
Figure 2.

mRNA expression of galectin‐3 (A), TNF‐ α (B) and IL‐6 (C) in the myocardial tissue of sham group (white bar), placebo group (gray bar) and ticagrelor group (black bar) in infarct area at 24 h, 3 days and 7 days post I/R. * P < 0.05 vs. sham‐operated group; † P < 0.05 vs. placebo group at the same time point; ‡ P < 0.05 vs. 24‐h group within the same treatment group
