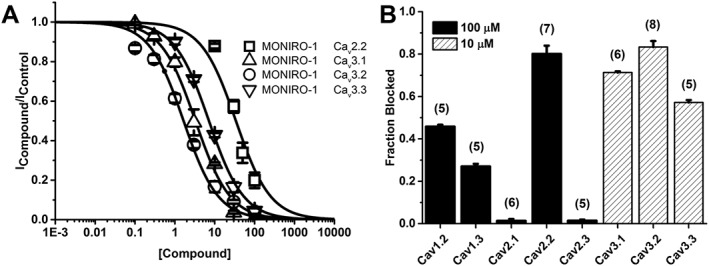
Figure 3.

MONIRO‐1 inhibition of voltage‐gated calcium channels. (A) Concentration–response of MONIRO‐1 at hCav2.2, hCav3.1, hCav3.2 and hCav3.3 channels expressed in HEK293 cells. Fitted curves gave IC50 values as shown in the Results. (B) Fraction of current inhibited by 100 (solid) or 10 μM (striped) MONIRO‐1 at Cav1.3, Cav2.1, Cav2.2, Cav2.3, Cav3.1 and Cav3.2 channels. Cells were held at −80 mV and pulsed at 0.1 Hz to the voltage determined to elicit the peak inward current previously determined from an I–V protocol. The number of cells is indicated in parentheses.
