
Figure 2.
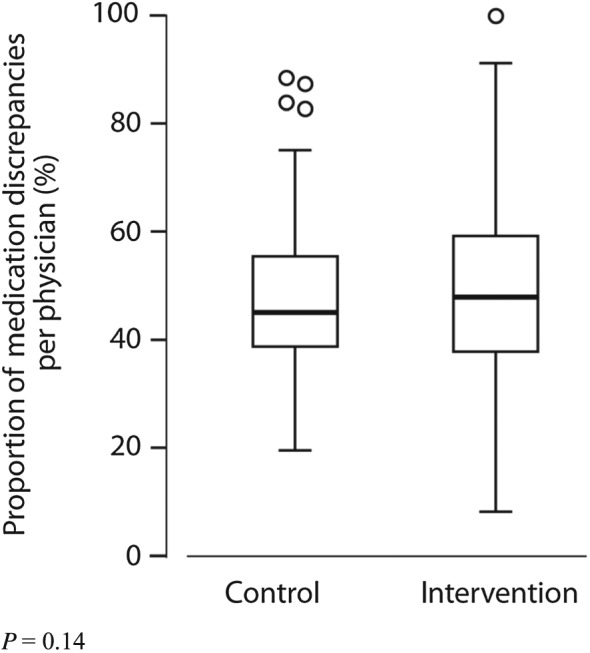
Effect of task analysis‐based intervention on medication discrepancies. The box portion of the box plot is defined by two lines at the 25th percentile and 75th percentile. The distance between the upper (75th percentile) and lower (25th percentile) lines of the box is the inter‐quartile range (IQR). The line inside the box is the median (50th percentile). The line with a crossbar line that goes out from the box is the box plot whisker. For the upper whisker boundary, it is the largest observation that is less than or equal to the upper edge of the box plus 1,5 times IQR. The small circles are outliers: datapoints outside the whisker boundaries