Figure 2.

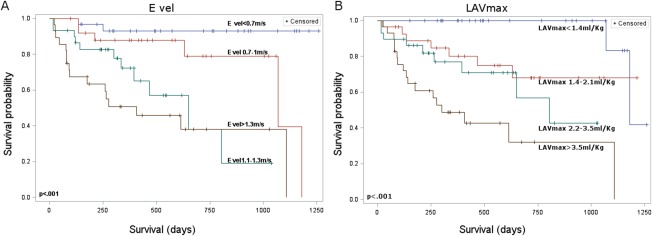
Kaplan‐Meier survival curves of the two variables that remained significant in the multivariable analysis for 115 dogs with myxomatous MV disease. E vel, E wave velocity; LAVmax, left atrial maximal volume

Kaplan‐Meier survival curves of the two variables that remained significant in the multivariable analysis for 115 dogs with myxomatous MV disease. E vel, E wave velocity; LAVmax, left atrial maximal volume