
Figure 5.
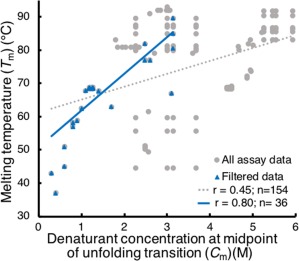
Plots of C m versus T m for Gβ1 data. A plot of all Gβ1 mutant sequences for which both a T m and C m were measured (gray circles) gives a moderate correlation (r = 0.45, dotted gray line). If we only include data obtained under similar assay conditions (restricting C m data to guanidinium chloride denaturation, pH 5–7, 20–30°C, and T m data to pH 5–7, no denaturant added) (blue triangles), a very strong correlation (r = 0.80, blue line) between these two measures of stability is observed.