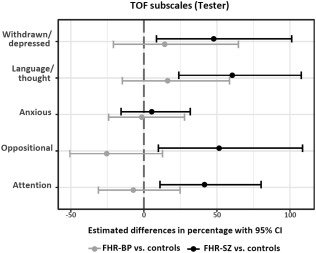
Figure 3.

Percentage differences in mean scores of subscales of the Test Observation Form (TOF). The population‐based control group is set as reference (the vertical dashed line). FHR‐SZ – children with familial high risk for schizophrenia spectrum psychosis, FHR‐BP – children with familial high risk for bipolar disorder
