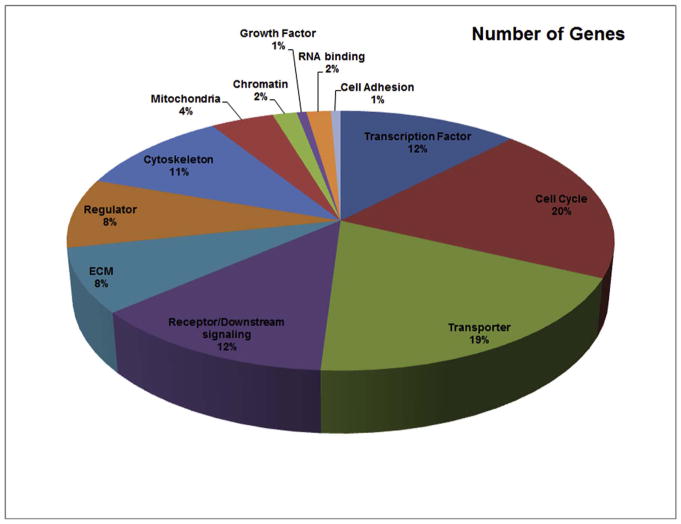
Fig. 2.
GO analysis of biological function and the percentage of the genes in each category.
(A) Heat map representation of microarray gene signaling. A two-color heat-map, with the brightest green, yellow, and brightest red colors of the color scale used for values to generate up and down regulation of microarray samples. (B).

