
Fig. 4.
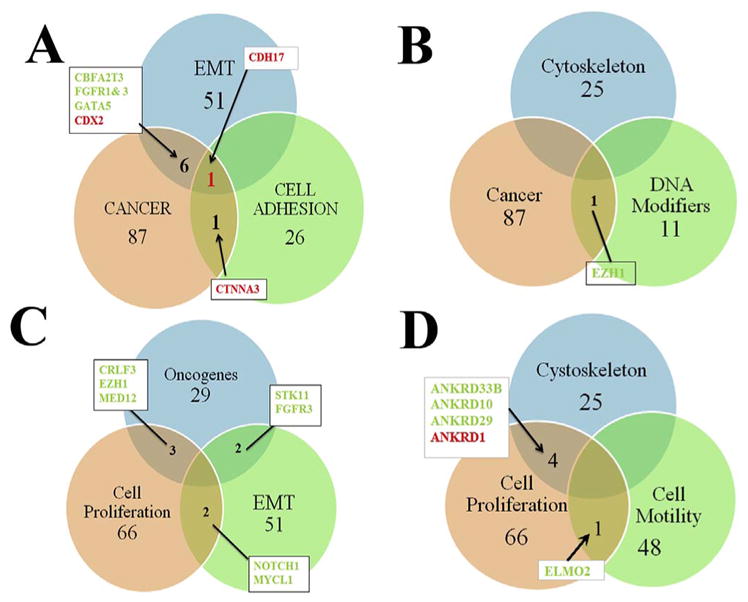
Slit2 microarray results in Venn diagrams arrangements.
We generated Venn diagrams from our microarray as a way of representing group of genes affected by Slit2. A shows diagram for EMT, cancer and cell adhesion molecules. CDH17 was the only common gene among these three groups. B shows cytoskeleton, cancer and DNA modifiers, we only found EZH1 gene from cancer and DNA modifiers combined. C shows oncogenes, EMT and cell cycle gene arrangement. We did not have a triple positive among the three but NOTCH1 and MYCL1 between EMT and cell cycle. D shows cytoskeleton, cell cycle and cell motility combination. Here Ankyrins were common among cell cycle and cytoskeleton, while between cell cycle and motility only ELMO was the common gene. Names in red indicates upregulated genes, in green, downregulated.