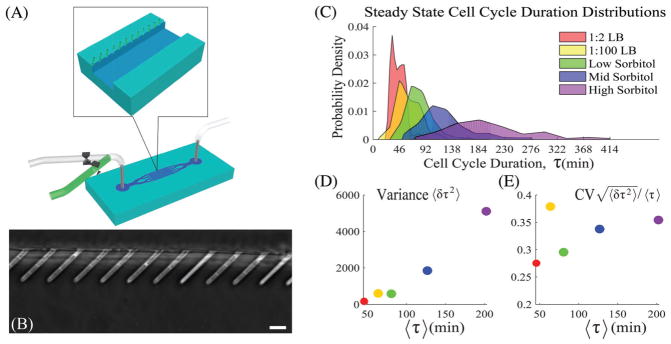
Fig. 1.
(A) Cartoon of the mother machine. (B) An image displaying E. coli cells in the microchannels. The scale bar is 5 microns. (C) E. coli cell cycle duration distributions (CCDDs) measured at constant nutrient conditions. See the Section III (ESI†) for more details. (D) Measured variance of the cell cycle duration. (E) Coefficient of variation (CV) of the cell cycle duration: CV is roughly constant across all conditions. Please see Fig. S1 (ESI†) panel B for a direct overlay of the distributions displayed in (C) and scaled by the respective mean values.

