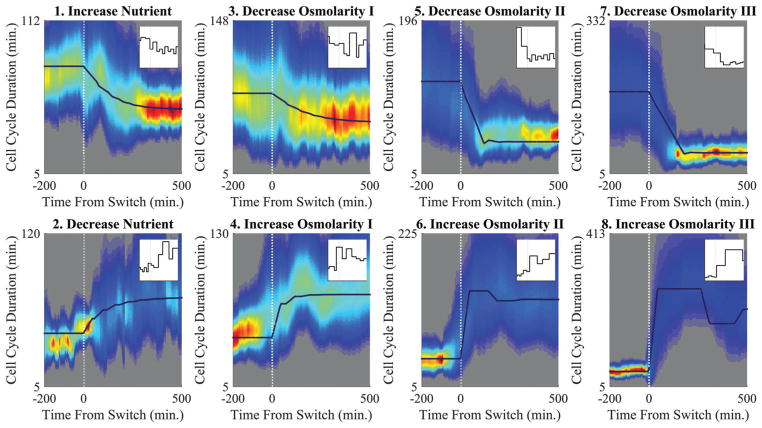
Fig. 3.
Eight step environmental change experiments. The experimental distributions (here fitted to Gamma distributions and smoothed; see Fig. S5 (ESI†) for a direct comparison with the raw data) are displayed using colors with highest probability in red and lowest probability in blue. The black lines are the model predictions for the average. The insets are representable single cell trajectories. The magnitude of the environmental shock increases from left to right across the figure in both rows. The difference in the mean stationary CCDD from the start of the experiment to the finish is approximately: for experiments 1 & 2 20 min, 3 & 4 40 min, 5 & 6 80 min, and 7 & 8 150 min. Please see Section IV (ESI†) for more details.

