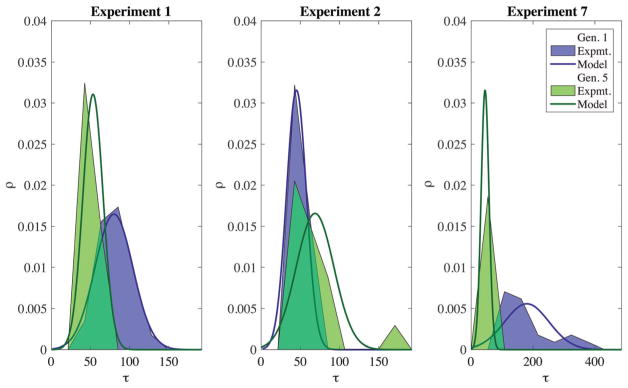
Fig. 4.
Comparisons between model and experiment of the initial (generation 0) and final distributions (first generation at which the population is equilibrated to the final state) from three representative experiments. The x-axis is τ (min): the cell cycle duration and the y axis is ρ (1/min): the probability density. The three experiments displayed are, from left to right: Experiment one, nutrient increase; Experiment two, nutrient decrease; and Experiment seven, the removal of the highest osmotic stress tested.

