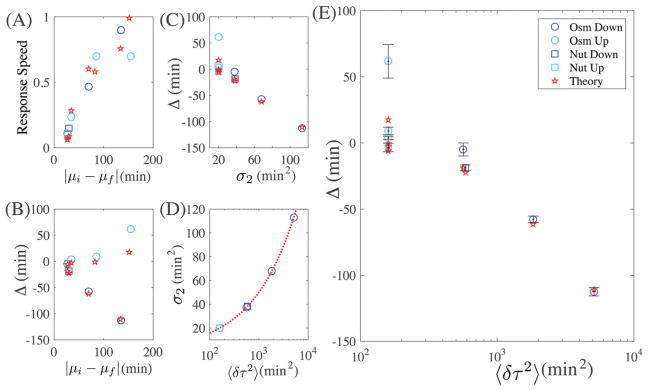
Fig. 5.
(A) Average cell response speed vs. shock severity: |μf − μi|. (B) Δ vs. shock severity |μf − μi|. (C) Δ vs. σ2 for the initial ensemble before the step change. (D) σ2 vs. variance of the cell cycle duration 〈δτ2〉 derived from the autocorrelation function before the step change. (E) Δ vs. variance (bars denote standard deviation). As the variance of the initial CCDD before the environment change increases, Δ decreases, and thus the response efficiency improves. Theory results are displayed as red lines or stars.

