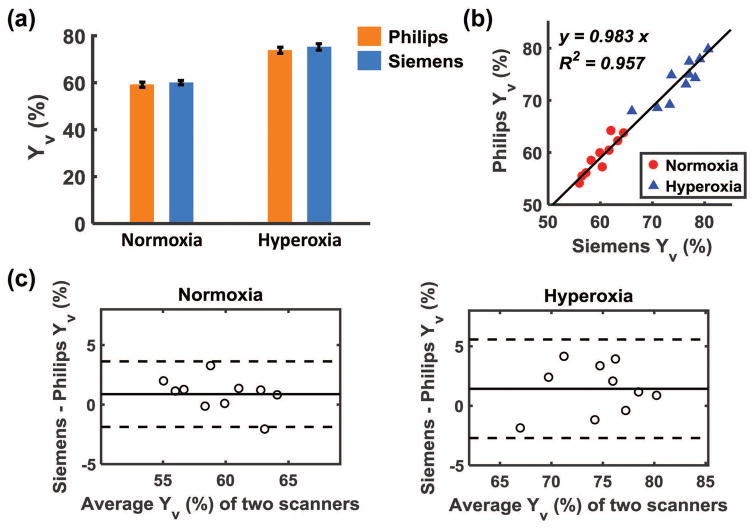
Figure 3.
Comparison of Yv values measured on Philips and Siemens scanners. (a) Yv from both scanners under normoxia and hyperoxia conditions. (b) scatter plot of Yv measured on the two scanners for each subject. Each dot represents data from one subject under normoxia (red circle) or hyperoxia (blue triangle). The solid line indicates the fitted linear regression curve. (c) Bland-Altman plots comparing Yv measurements on Philips and Siemens scanners under normoxia and hyperoxia, respectively. The solid line indicates the average difference between Siemens and Philips measurements. The dashed lines indicate the 95% confidence interval.

