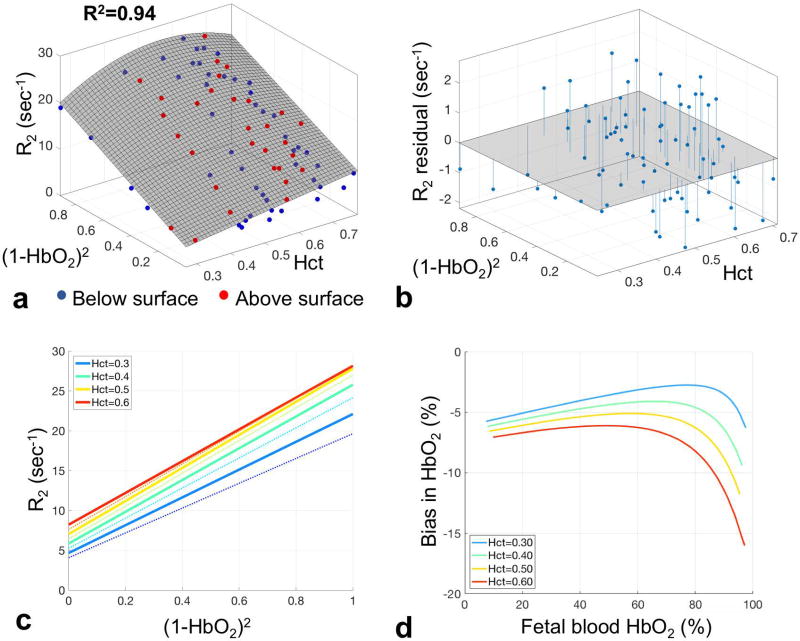
Figure 3.
(a) Blood R2 as a function of the square of deoxyhemoglobin fraction (1 − HbO2)2 and Hct from 77 fetal blood samples, measured with a T2-prepared bSSFP sequence along with fitted surface R2 = R2o(Hct) + k · Hct · (1 − Hct) · (1 − HbO2)2 in gray; R2=0.94. Red and blue markers represent data points above and below the fitted surface, respectively. (b) Plot of the residuals of R2 measurements w.r.t the fitted surface of panel (a). (c) Profiles of R2 versus (1 − HbO2)2 derived from data of panel A. Thin lines correspond to profiles across the fitted surface in panel A for Hct values in the range of 0.25–0.65. Thick lines correspond to Hct values of 0.3, 0.4, 0.5 and 0.6. The corresponding K and R2o values are 17.4, 19.9, 20.8, and 19.9 s−1 and 215, 171 142, 122 ms, respectively. (d) Plot of bias in fetal blood HbO2 estimation introduced by using the adult blood calibration equation to convert fetal blood T2 to HbO2 values, for the same range of Hct values.

