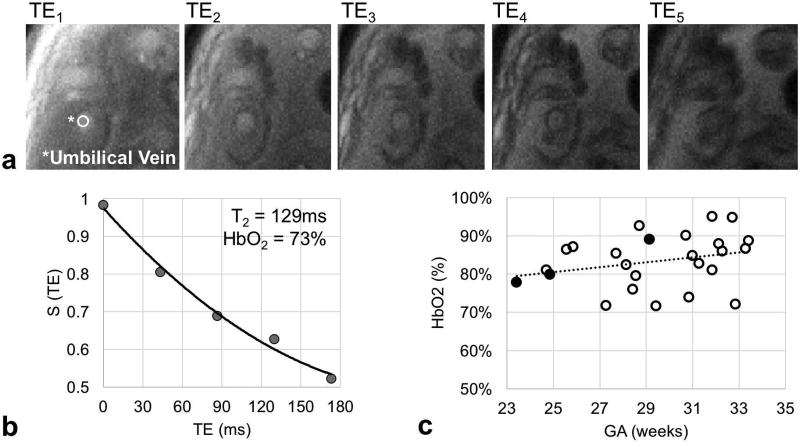
Figure 7.
(a) Example of images used to estimate umbilical vein blood T2. TE: echo time. (b) Plot of a T2 decay of the umbilical vein (UV) blood signal in vivo. T2 was estimated with a three-parameter fit S(t) = S0e−t/T2 + C, including TE correction. (c) Oxygen saturation (HbO2) at the UV was measured across gestational ages (GAs) in 26 participants in vivo. Open points indicate cases in which UV regions of interest (ROIs) are 6 or more pixels in diameter. Solid points indicate cases when ROIs are only 5 pixels in diameter.

