
Figure 2.
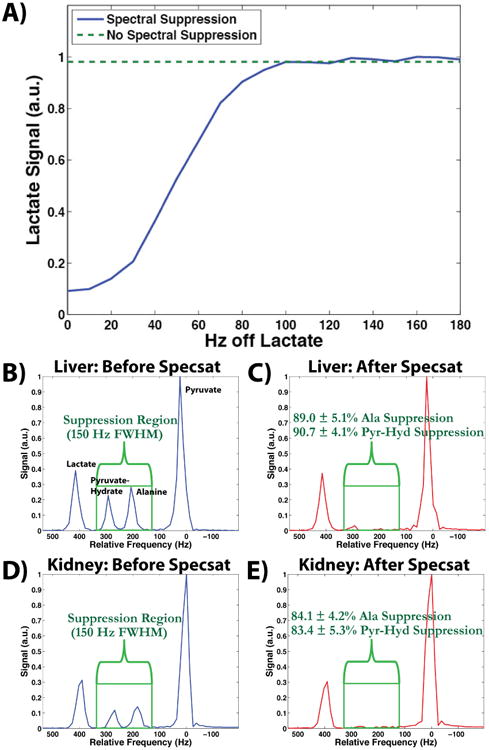
Slab-selective MRS results of the spectral suppression pulse. (A) The effect of the spectral suppression pulse is shown as a function of the distance of the spectral suppression pulse center frequency to the lactate peak in a thermal phantom (blue line). At ≥100 Hz the pulse has no effect on the lactate peak, which is indicated by the green dashed line and is representative of the baseline lactate signal when no spectral suppression pulses are present. (B, C) Parts B and C show the spectrum from a liver slab before and after the spectral suppression pulses, respectively. The pyruvate and lactate peaks remain unaffected, while the alanine and pyruvate-hydrate peaks are sufficiently suppressed by 89.0 ± 5.1% and 90.7 ± 4.1%, respectively. (D, E) Parts D and E show similar results from a kidney slab as parts B and C, with the alanine and pyruvate-hydrate peaks sufficiently suppressed by 84.1 ± 4.2% and 83.4 ± 5.3%, respectively.