
Figure 4.
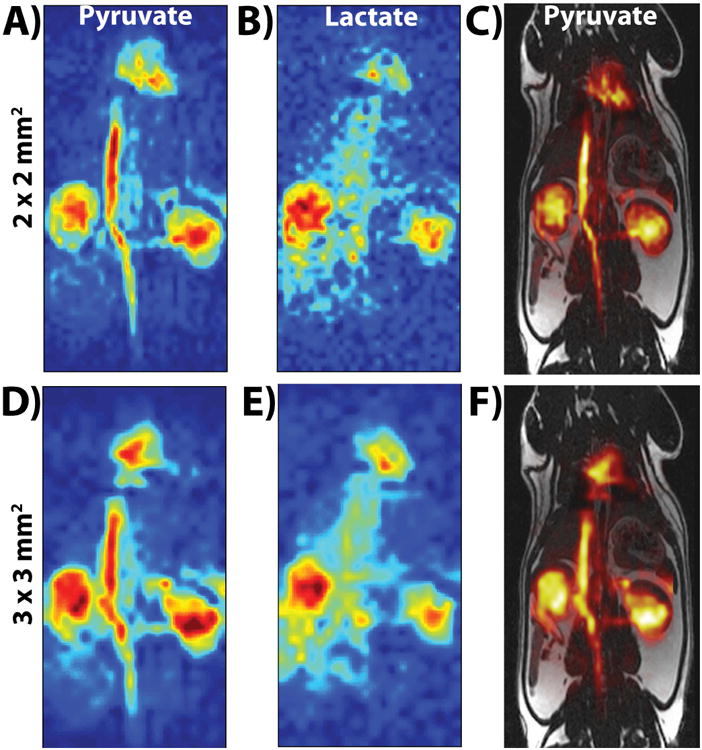
Parts A (pyruvate) and B (lactate) show the first time-point (20 s after start of injection) of the 2 × 2 mm2 in-plane resolution bSSFP acquisition, while parts D (pyruvate) and E (lactate) show the first time-point of the 3 × 3 mm2 in-plane resolution bSSFP acquisition. Parts C and F show the carbon pyruvate image overlaid onto the 1H anatomical image. The SNR (>40 for pyruvate and >15 for lactate) was high enough at both spatial resolutions to visualize pyruvate and lactate distribution in kidneys, heart, and vasculature. All images were zero-filled for display purposes.