
Figure 5.
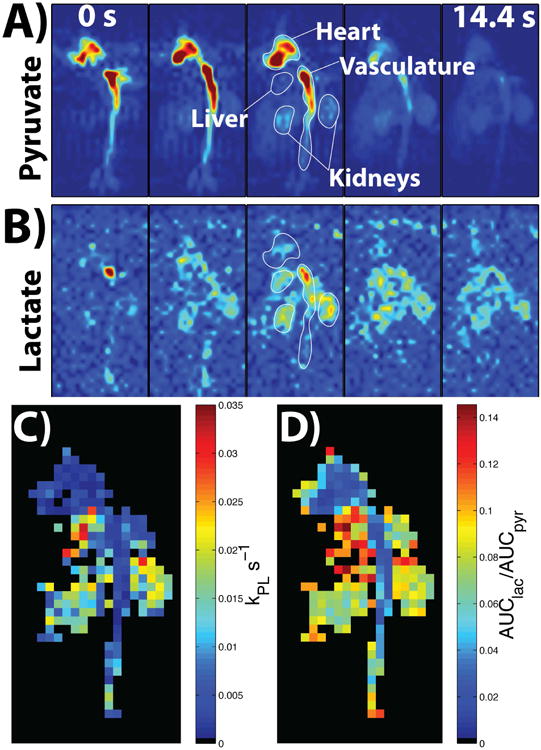
Parts A and B show the resulting images of pyruvate and lactate, respectively, from all the time-points of the 2D dynamic coronal projection scan, which started at 5 s after the start of injection (represented by the 0 s in the first time-point). The SNR was high enough to visualize heart, vasculature, and kidneys for both metabolites, with the pyruvate signal lasting in the kidneys to the last time-point. Part C shows the resulting kPL map with voxels in the vasculature and kidney featuring values that match up well with literature values (kPL ≈ 0.013 s-1 in kidneys and kPL ≈ 0.004 s-1 in vasculature (43)). Part D shows the AUClac/AUCpyr map, with the AUC ratio values agreeing well with the kPL values based on qualitative analysis, i.e. low heart and vasculature AUC ratio and kPL, higher liver AUC ratio and kPL, with kidneys being in between (44). The images in parts A and B were zero-filled for display purposes, while kPL and AUC ratio maps are at native resolution.