
Figure 7.
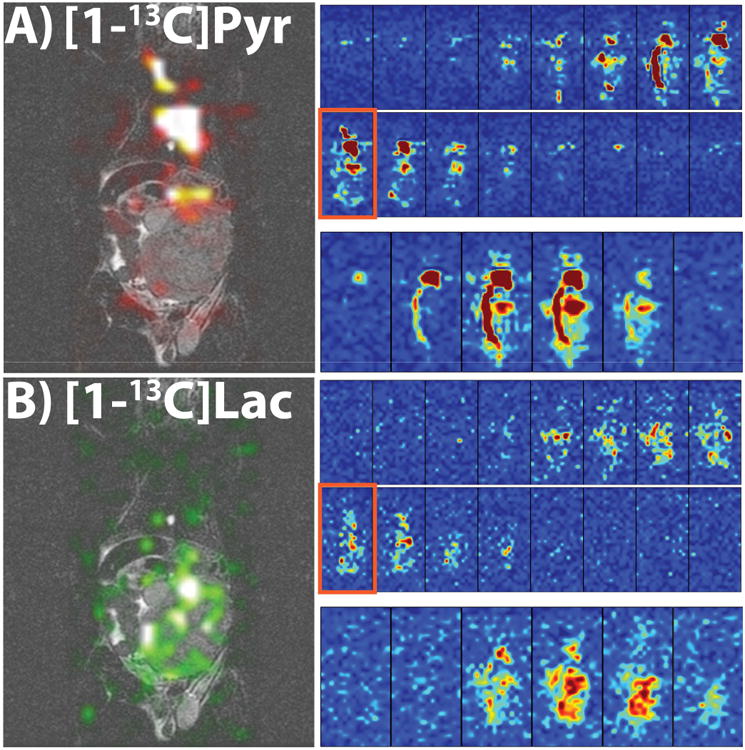
In vivo 3D dynamic tumor-bearing mouse results. (A, B) Results from a 3D dynamic 2.5 mm isotropic resolution acquisition in a tumor-bearing mouse. Parts A and B are of pyruvate and lactate, respectively, and the presented views are similar to Figure 6A and 6B. The SNR was high enough to visualize the metabolites and heart and tumor, with the signal lasting longer than in the rats, potentially due to a larger production of lactate in the tumor. All images were zero-filled for display purposes.