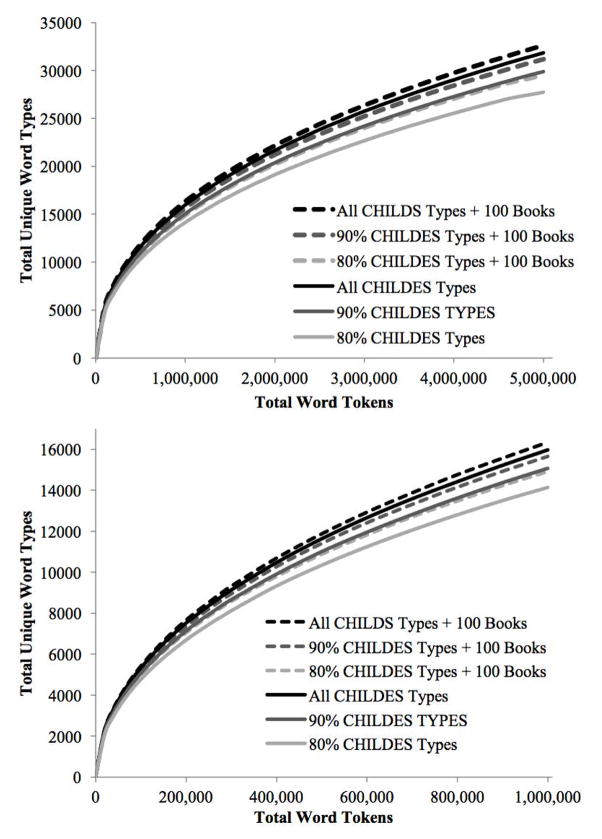
Fig. 5.
Type-token curves for six hypothetical children. The three solid lines refer to the same three hypothetical children plotted in Figure 4. The three dashed lines refer to what these three children’s linguistic input would look like that they additionally received linguistic input in the form of the text of 100 picture books. The bottom panel enlarges the bottom-left portion of the top panel, showing type counts for up to one million total word tokens (note the scale invariance of the curves).

