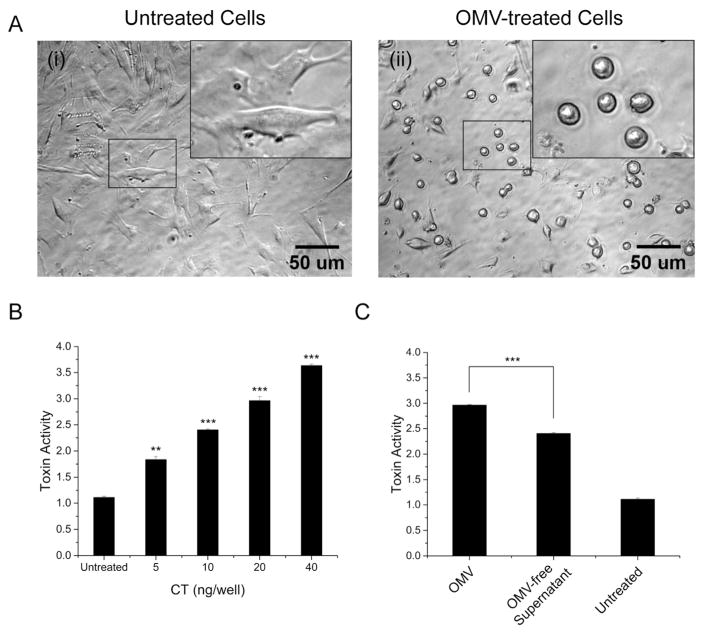
FIGURE 2. V. cholerae 569B OMV-mediated cytotoxicity.
(A) Representative phase contrast image of OMV-treated FHs 74 intestinal epithelial cells. (i) Untreated cells and (ii) OMV-treated cells (0.4 ng/μL of CT, 4 hr). Enlarged view of the regions in small boxes are shown in the insets. (B) Quantitative analysis of the OMV-treated cell morphology. Cells were treated with a serial dilution of 569B OMVs (5 to 40 ng CT/well), and the resulting morphology scored on a scale of 1 (spindly) to 4 (rounded), based on the percentage of cell rounding. Data are expressed as mean ± SD (N=3). One-way ANOVA followed by Bonferroni’s post hoc test was used to compare differences between treated and untreated samples. * p < 0.05, ** p < 0.01, and *** p < 0.001. (C) Quantification of 569B OMV- and OMV-free supernatant-mediated cytotoxicity. Cells were treated with purified OMVs or OMV-free supernatant. Control cells were treated with HBSS. OMV-mediated alterations in cell morphology were scored on a scale of 1 (spindly) to 4 (rounded). Data are expressed as mean ± SD (N=3). The level of significance was determined between cells treated with OMVs and OMV-free supernatant using an unpaired two-tailed t-test. *** p < 0.001.

