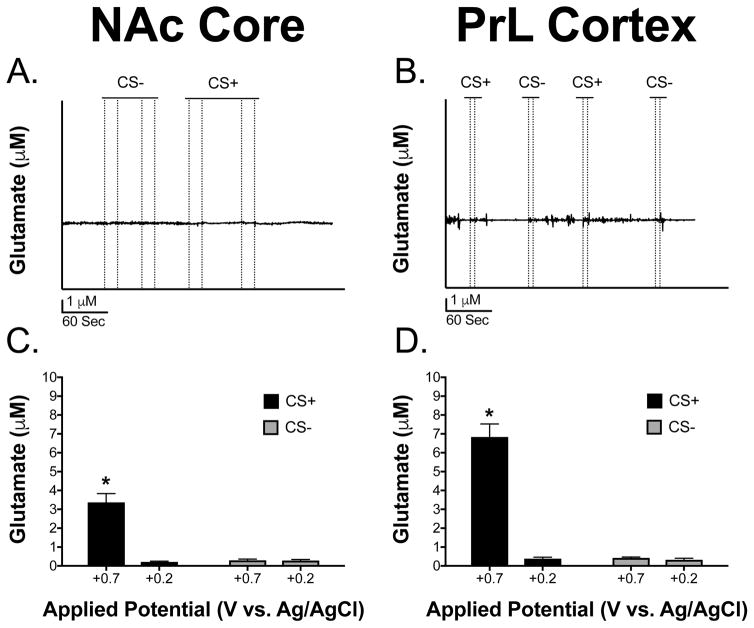
Figure 5. Glutamate release in the NAc core and PrL cortex and the effects of applied potential on MEA responses.
(A) Representative trace at the +0.2 V potential (unable to detect glutamate) in the NAcC. (B) Representative trace at the +0.2 V potential (unable to detect glutamate) in the PrL. Notice how glutamate events are absent in response to the stimuli; however, there is some noise in the signal which is contributing to the increase seen in the bar graph at +0.2 V potential. Dashed lines represent lever onset and offset, respectively. (C/D) There was a significant stimulus × potential × brain region interaction with a greater concentration of glutamate release seen in the PrL and NAcC to the CS+ at the +0.7 V potential compared to all other stimuli presentations, brain regions, and potentials [F(1,8) = 14.24, *p < 0.05]. Note that release in the PrL to the CS+ at the +0.7 V potential was significantly greater than release in the NAcC to the CS+ at the +0.7 V potential (Tukey HSD, *p < 0.05). Data are presented as mean ± SEM; n = 5/brain region.

