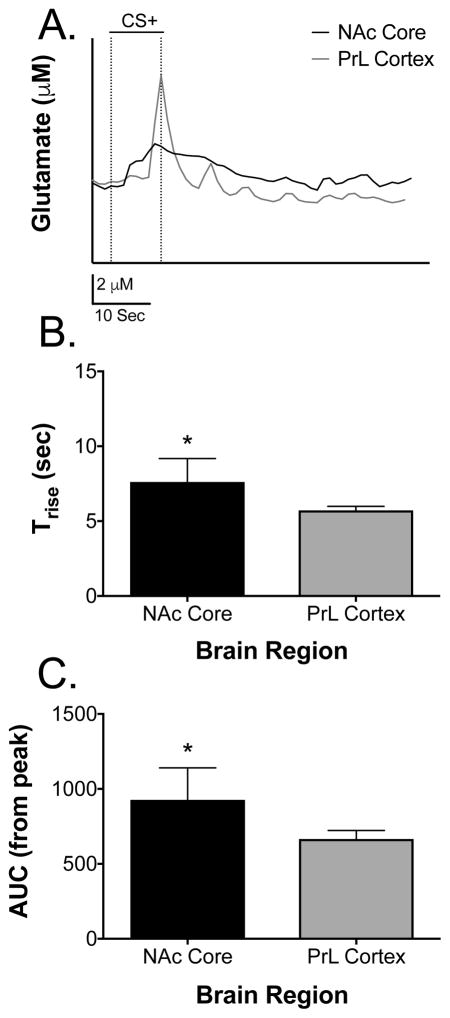
Figure 6. Average time course data of CS+-induced glutamate signals in the NAc core and PrL cortex.
(A) Representative layover trace of CS+ elicited glutamate release in the NAcC and PrL. Notice the difference in release rise and decay. Dotted lines represent stimulus onset and offset. (B) Trise measures were significantly longer in time course in the NAcC compared to the PrL [t(8) = 2.54, p < 0.05]. (C) AUC measures from the peak amplitude were significantly larger in the NAcC compared to the PrL [t(8) = 2.36, *p < 0.05]. Data are presented as mean ± SEM; n = 5/brain region.

