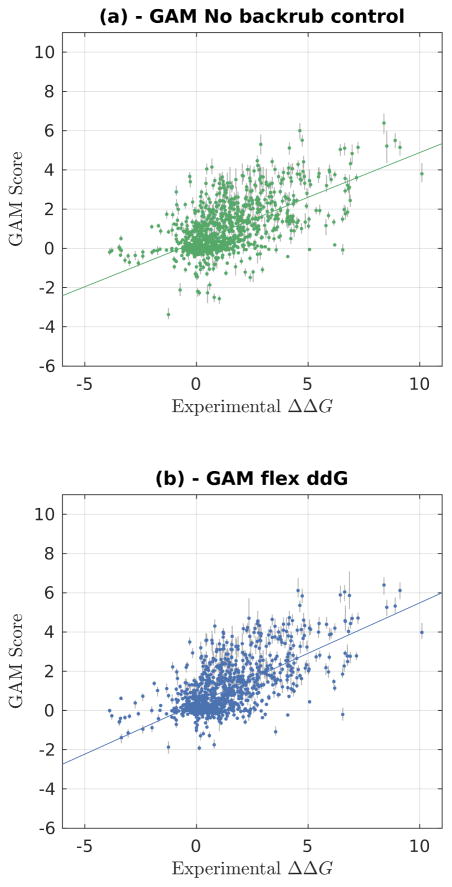
Figure 5.
Experimentally determined ΔΔG values (x-axis) versus predictions using a Generalized additive model (GAM). The complete dataset is shown. GAM scores are refit from values in Rosetta Energy Units (REU) using the Rosetta Talaris 46,48,49 energy function. The error bars in gray represent the range from minimum to maximum fit predicted ΔΔG value for the 1000 sampled GAM models. (a): Control (no backrub) Rosetta predictions. (b): Flex ddG Rosetta predictions using 35,000 backrub steps and 50 output models. A line of best fit is shown in each of the panels.

