Figure 2.
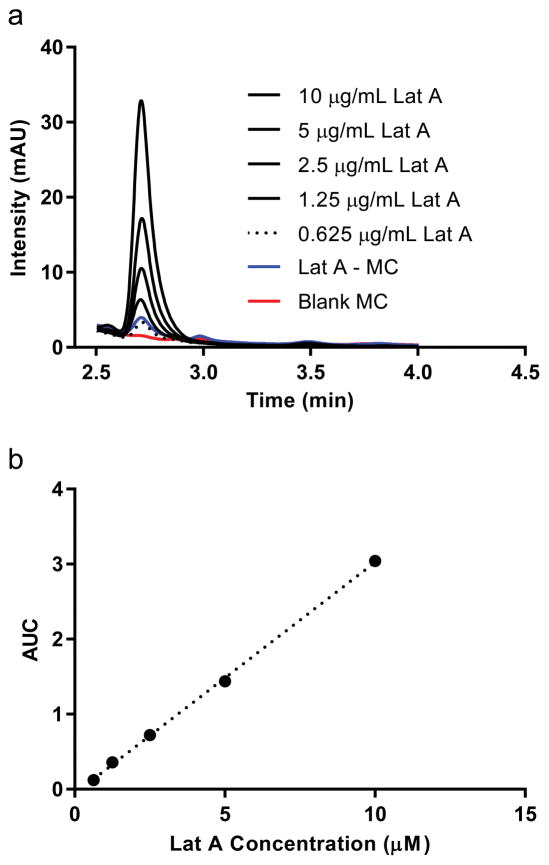
Loading of Lat A into PEG-bl-PPS micelles. Following assembly and loading via nanoprecipitation, Lat A concentrations within micelles was quantified using (a) high performance liquid chromatography (HPLC) that referenced a reproducible (b) standard curve of serially diluted free form Lat A. A 95:5 Methanol:Water mobile phase and Lat A was detected by absorption at 235 nm. All reported concentrations of Lat A and loaded micelles (Lat A-MC) refer to Lat A concentrations determined by this HPLC-based method. One example measurement (blue line) of micelle loading quantification is shown, which matched the concentration of free form Lat A at 0.625 mg/mL (dotted line).

