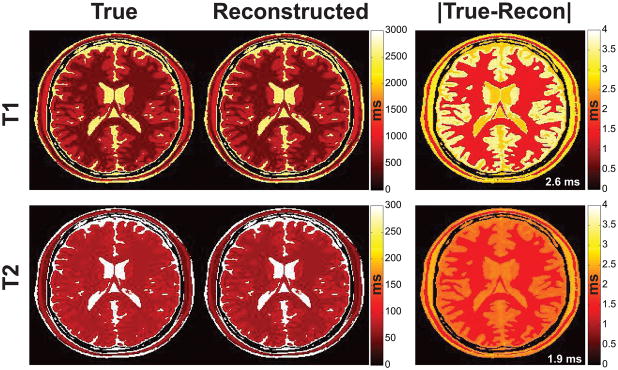
Fig. 3.
True and reconstructed T1/T2 images from the numerical brain phantom shown on a common ms scale and the associated absolute error map. The true phantom values approximate those of the in vivo brain, e.g. white matter T2 > 70 ms. Note the close agreement between the reconstructed and true maps. The T1 and T2 RMSEs of 2.6 and 1.9 ms respectively are shown inset in white in the error map for this noiseless acquisition.

